Blender has Python inside, which can be applied to data visualization.
This article explains how to import data and its application, including uploading it to STYLY.
About This Article
This article will explain how to use the Python functionality available in Blender to visualize the data and make it STYLY available.
The following earthquake simulator can be produced.
The results can be played back using VR equipment such as Meta Quest 2, allowing you to visually demonstrate the need to prepare for earthquakes. This will be useful not only for experiencing disaster prevention at home but also in places where disaster awareness needs to be raised, such as local governments and educational institutions.
Since the presentation explains how to visualize numerical data, it will be useful information for learning and various presentations with highly persuasive images.
What is Python?
Python is a programming language used for a variety of purposes and is widely used by companies and organizations around the globe.
Because of its language specification, it is also a popular language for numerical computations in statistics, data science and other fields.
Python is built into Blender, and many of Blender’s processes are actually managed by Python. Most of the add-ons are also written in Python.
Therefore, Blender has a Python runtime environment built in, allowing it to run Python in an almost complete form.
For example, this can be used to create particle lives.

What is Data Visualization?
In this article, I will show you how to visualize data using Python.
Simply put, data visualization is the process of replacing numerical information that exists as data with something more easily viewable.
One example of data visualization is a graph drawing in spreadsheets.
Graph drawing is the process of converting what exists as numerical information into information that is easier to see visually.
Blender uses Python to convert numerical data into easy-to-visualize information.
This has the following characteristics:
- Numerical data can be represented in a visually rich manner.
- Can use animation to display information visible through changes in numerical values as a movement.
This allows for the following applications:
- Animating numerical data to show the movement of numerical values from multiple angles.
- Creation of infographics.
Visualizing Seismograph Data
Data Acquisition
Japan is a country where earthquakes occur frequently, and the Japan Meteorological Agency constantly observes them, especially for strong earthquakes, it releases them to the public as strong-motion observation data.
STYLY is releasing assets that are useful for disaster prevention. It can be used for disaster prevention planning and other purposes such as ….
In the area of disaster prevention, Python can be used to visualize the shaking of an earthquake.
By using animation with this data, you can do the following:
- Forecasting what kind of shaking could occur and preparing for it.
- Visualizing earthquake experience using VR.
First, let’s collect the data to be used.
From the Strong-Motion Observation Data site, select Earthquake.
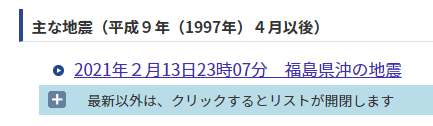
Strong-motion data selection
At the time of writing, “February 13, 2021 23:07 Off the coast of Fukushima Prefecture” is the latest available, so this is the one we will use.
Next, the location is displayed, so select the data you would like to use.
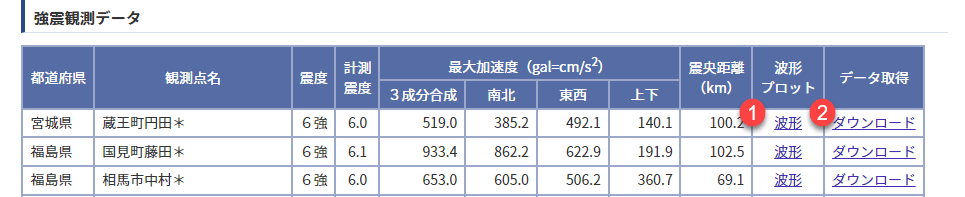
List of seismic data
Clicking on “Waveform” under “Waveform Plot” in the red annotation 1 here and “Waveform” in the red annotation 2 below will display a graphical representation of the waveform, and clicking on “Download” under “Get Data” will allow you to download the data in a CSV file.
This CSV file contains data for north and south shaking, east and west shaking, as well as up and down shaking every 1/100th of a second.
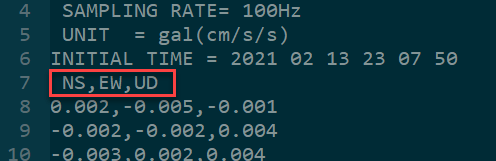
CSV Data Contents
This time we would like to take this data as animation data and import it as 3D data.
Explanation of Python Code
The code used in this case will be as follows:
import bpy, csv

data = "FILEPATH" # (1)
current_scene = bpy.context.scene
target_object = current_scene.objects["Cube"] # (2)

scale = 100 # (3)
interval = 1 # (4)

current_frame = 1

with open( data, encoding='shift_jis' ) as csvfile: # (5)
  reader = csv.reader( csvfile )
  for i, row in enumerate( reader ):
    if i < 8: continue # (6)
    x, y, z = row[0:3]
    x = float(x) / scale
    y = float(y) / scale
    z = float(z) / scale
    target_object.location = (x, y, z)
    target_object.keyframe_insert(data_path="location", frame=current_frame*interval)
    current_frame += 1
The above code is annotated with (1) through (5) as comments, each of which is explained below.
(1) Specify the location of the CSV file here.
(2) The object to which motion is applied, in this example Cube (default cube) is specified.
(3) Reduce the shaking width. The larger the number, the smaller the shaking.
(4) Frames to be inserted in between (the larger the number, the longer the playback time becomes).
(5) Strong-motion observation data is in Shift-JIS, so encoding is specified.
(6) Ignore the first 8 lines as they are header data not to be extracted.
Importing Python Code
Step 1: Switch to text editor
Let’s get started using this in Blender.
Use the built-in “Text Editor” to work with Python in Blender.
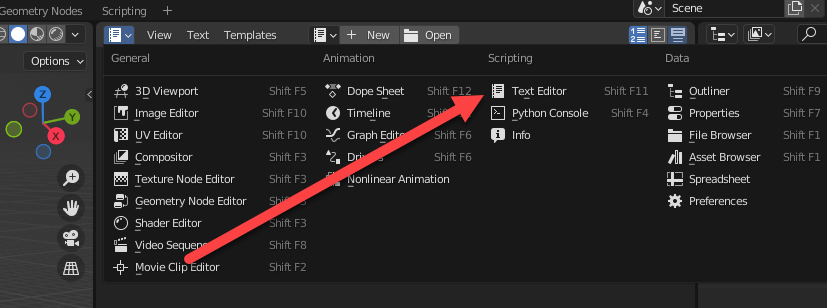
Blender’s Text Editor
Step 2: Creation of new data
When you switch to the text editor, you will see a blank screen like this, but press “New” at the top.

Create new text
This gives the following empty text editor.
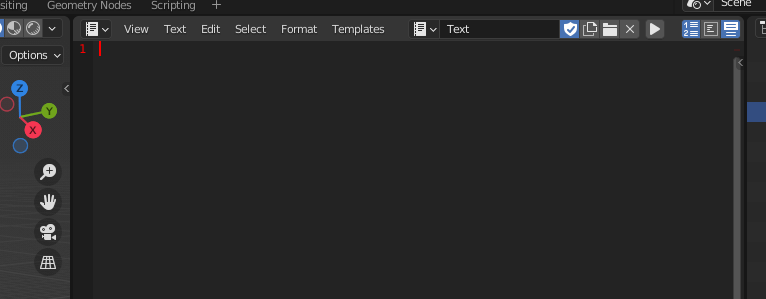
Empty text editor
Step 3: Add Python code
Try pasting the above code here.
Note that pasting from this article may result in an error because the indentation is lost.
Indentation is important in Python, so if pasting fails, try pasting from the Gist code.
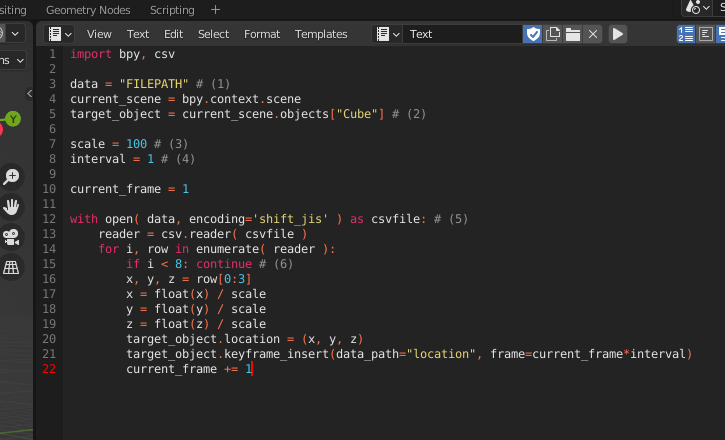
After pasting
In this code, change the part of (1) ‘FILEPATH’ to the actual file name.
The file name must be specified as an absolute path.
In a Windows environment, replace the backslash (“\” or circle symbol) with a forward slash (“/”).
In other words, “C:\Data\data.csv” becomes “C:/Data/data.csv”.
Execution of Capturing Process
After setting this up, let’s get to processing.
Click on the “Play” button in the upper right corner of the screen to start the process.
If this button is not visible, the display area may be too small, so try expanding the window.
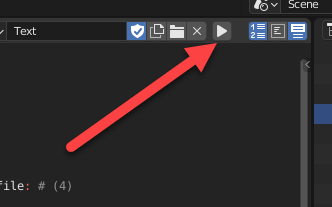
Running Python
If an error occurs, you can see it from the console screen.
If not, try clicking “Toggle System Console” to view it.
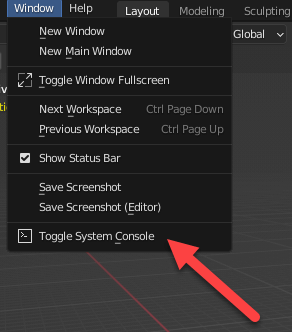
Console Display
In most cases, you will get an error such as a wrong file name, so correct the error and try again.
If the execution succeeds, processing will begin. Since strong-motion observation data is large data, it will take a while to process, so please leave it as it is until it finishes.
Confirmation of Imported Data
Keyframe
When the process is complete, keyframes will be placed on the timeline as shown here.
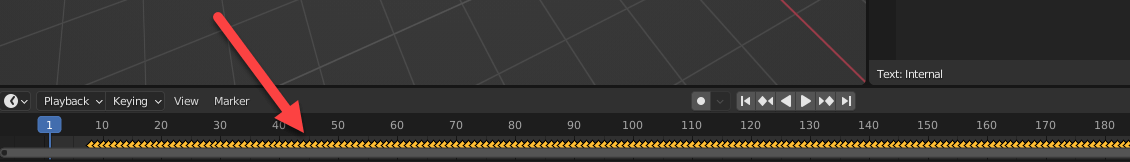
Timeline after processing
Animation Curve
Take a look at the animation curves in the Graph Editor.

Switch to Graph Editor
After switching, select the Cube object displayed on the 3D viewport, this time assigning the animation to the Cube object.
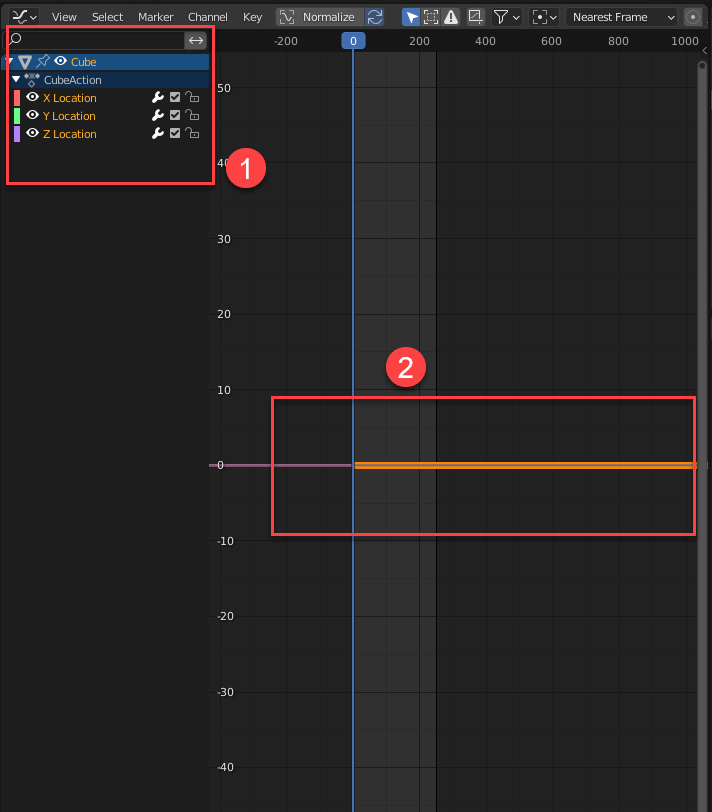
Added Animation
Here, X, Y, and Z position information and a graph have been added to the red annotation 1 in the upper left corner.
If the graph is difficult to see as it is, you could try moving it with the mouse wheel or middle button.
Move/expand graph display
Checking the Number of Frames
There are 18007 frames of animation in this seismic data. If you try to play it as it is, it will not play all of them, so the last frame needs to be changed.
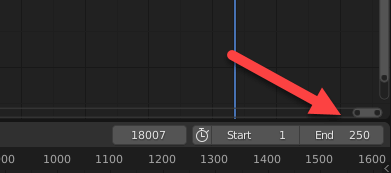
End Frame
Change this number to 18007.
Next, under “Output Property,” the “Frame Rate” defaults to 24 fps, but change this to 100.
There is no option for 100, so select Custom.
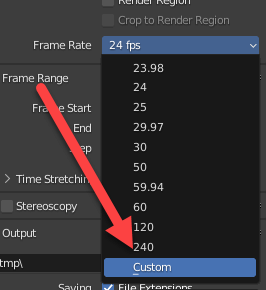
Select Custom
Next, you will see a box for “FPS” and specify 100.
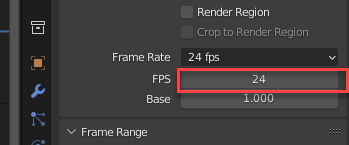
Set FPS
Checking Playback Settings
Before playback, change the playback settings.
The necessary setting is to change the “Playback” > “Sync” setting to “Frame Dropping”.
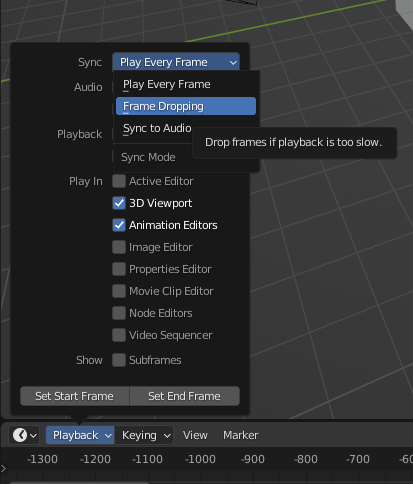
Playback Settings
If you use the default setting “Play Every Frame”, Blender will play all animation frames resulting in the following problems
- It may take longer than normal to playback if the processing cannot keep up.
- It may playback slower when the screen refresh rate is low (in this case, for example, using a 60 Hz screen for a frame rate of 100).
Therefore, if the data cannot be displayed with this setting, the frame playback itself will be skipped and priority will be given to time accuracy.
Clearly, this change could be vital for real-time data such as seismogram data.
Playback
Press the [Space] key to start playback.
As it plays, it will remain still for a while, but you will see the shaking gradually become more and more intense.
Seismograph data played back (actually displayed more smoothly)
It can also be output as FBX and uploaded to STYLY for playback as is.
Application of Captured Data
Let’s use earthquake data in STYLY.
This time, we will create a simple earthquake simulator.
To this end, we will resort to the room model used in the previous explanation of the asset browser and configure it to place objects around it as the ground.
![[Blender] How to Super-Efficiently Create Scenes with the New Asset Browser](https://styly.cc/wp-content/uploads/2022/02/asset-browser-eyecatch-160x160.png)
We are about to reproduce the shaking, but it is difficult to experience the shaking on screen or even in VR.
To circumvent this difficulty, we choose to fix the scaffolding as a room and shake the surrounding scenery to simulate the experience of an earthquake.
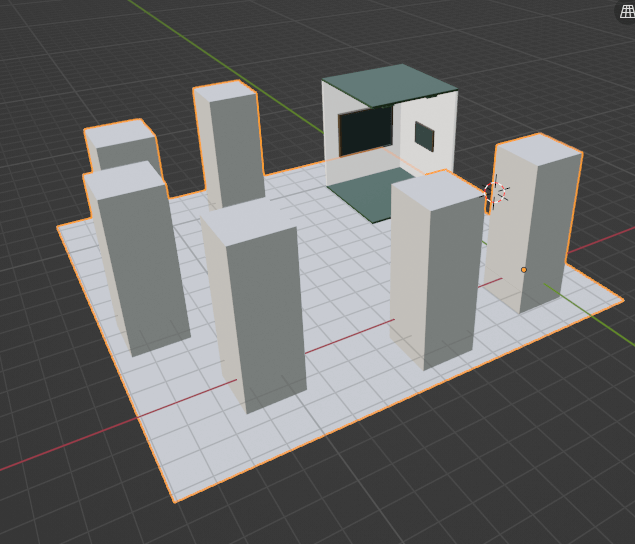
Earthquake Simulator Model
To better understand the movement of the ground, we place several boxes on the ground.
Since the ground and the boxes share the same motion, we can select the ground and the boxes and merge them by pressing [Ctrl]+[J].
Next, we assign the seismic data to this ground.
The following code is what we used this time.
import bpy, csv

data = "FILEPATH"
current_scene = bpy.context.scene
target_object = current_scene.objects["Env"]

scale = 100
interval = 1

current_frame = 1

with open( data, encoding='shift_jis' ) as csvfile:
  reader = csv.reader( csvfile )
  for i, row in enumerate( reader ):
    if i < 8: continue # (6)
    x, y, z = row[0:3]
    x = float(x) / scale * -1
    y = float(y) / scale * -1
    z = float(z) / scale * -1
    target_object.location = (x, y, z)
    target_object.keyframe_insert(data_path="location", frame=current_frame*interval)
    current_frame += 1
If you use the code, it is a good idea to get it from Gist as noted above.
The code is similar to the previous one, but the bolded part has changed.
This was inverted by setting it to -1.
In this case, the room we are standing in is stationary and the scenery around it is moving instead. By inverting the code, the illusion of motion is replaced by the actual motion.
In my implementation, keyframes were hit, which I output as FBX and uploaded via Unity.
![[Introduction to Blender] How to make animation](https://styly.cc/wp-content/uploads/2021/05/IMG_92011-160x160.png)
STYLY displays as follows:
When experienced in VR, the intensity of the shaking can be felt.
Some sensitive people may even feel as if they are actually experiencing strong shaking. So, please pay attention to safety and be careful not to collide with surrounding objects.
How to Upload to STYLY
How to create an account:

How to upload to STYLY:
How to upload from Unity to STYLY:
If you have any questions about STYLY, bug reports, or requests for improvements, please contact the STYLY FORUM.
https://en.forum.styly.cc/support/discussions
As we have demonstrated here, using Python to import external data allows you to visualize and express various types of data in an appealing way.
We encourage you to experiment with importing various other types of data. Have fun!
Edited by SASAnishiki
Certified (QA) by Shota Shawn Yoshizawa
Translated by Sho Ishiwata